20. December 2019
Determining the Optimal Ripstik Frequency, Empirically
In my junior fall (2019), I took a class at MIT called 2.671, or Measurement and Instrumentation.
This class taught me a great many things that will come in handy for future academic reports and any possible research that I may produce. Specifically, I learned a lot about uncertainty, as well as how to use frequency-domain analysis in a practical manner to extract information that I am interested in.
The class had a series of weekly labs that everyone did, in addition to an overarching individual project that took the entire semester.
Given my natural inclination towards somewhat strange experiments and setups, I naturally chose a proper dynamic system to investigate: the Ripstik.
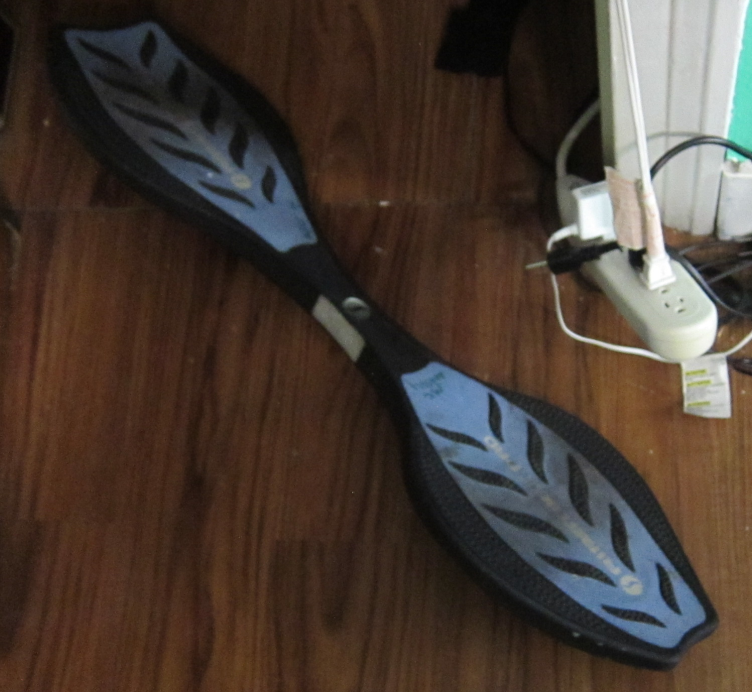
The Ripstik Air Pro in all its glory.
For context: my floor in my wonderful dorm at MIT was essentially a 300 foot long hallway – perfect for riding a Ripstik up and down at all hours. Our floor in particular had several Ripstiks (proper as well as fun knockoffs), one of which was mine.
(Never mind that the one I possessed I had bought for ten dollars the prior year off a graduating senior, who used it as a window opener. Naturally, I could not allow such an injustice to continue, and I gave it proper usage around campus.)
Anyone who’s ridden a Ripstik knows the basic mechanism: you are displacing in what I’m calling the XZ-plane (which is normal to the board’s “forward” direction, or Y-axis), tilting the panels of the board up and down. This causes the inclined caster wheels (mounted at 30 degrees off axis) to shift into a position that increases their potential energy. The caster wheels, with the help of gravity pulling on the panels from your body weight, force the caster wheels to want to return to the inline orientation. This turns your XZ tilt impulse into an inline “forward” impulse. Continue doing this in a rhythmic pattern and you can go relatively smoothly over long distances even if you are continually rocking back and forth locally.
Once your muscle memory is good enough with normal Ripstik riding, you are eventually able to do tricks like drifting, turning, and seamless obstacle dodging, as well as perform normal tasks like eating dinner or using your laptop computer while casually riding up and down hall. This last item will be relevant to the work at hand shortly.
Intuitively, one might see that one of the primary variables in how fast you ride a Ripstik (given the same environmental conditions) is your driving frequency – the amount of times per second that you pump your legs back and forth. Additionally, one might see that if you drove at a frequency of 0 Hz, you wouldn’t go anywhere. Similarly, one might see that if you drove at an infinite / very high frequency, you also wouldn’t go anywhere – you wouldn’t allow any time for the caster wheels to revert back into position from your weight!
So we know that a positive velocity can be produced, and that this positive velocity is produced at a finite, positive, nonzero oscillation frequency.
That tells us there’s got to be a maximum somewhere in there; Rolle’s theorem requires it. [Rolle’s Theorem tells us that between two endpoints of the same y-value, the derivative must be zero somewhere within those bounds; since we know that the velocity is positive somewhere in there, we know that a maximum must exist.]
So for my Measurement and Instrumentation project, I set off to find the optimal Ripstik drive frequency.
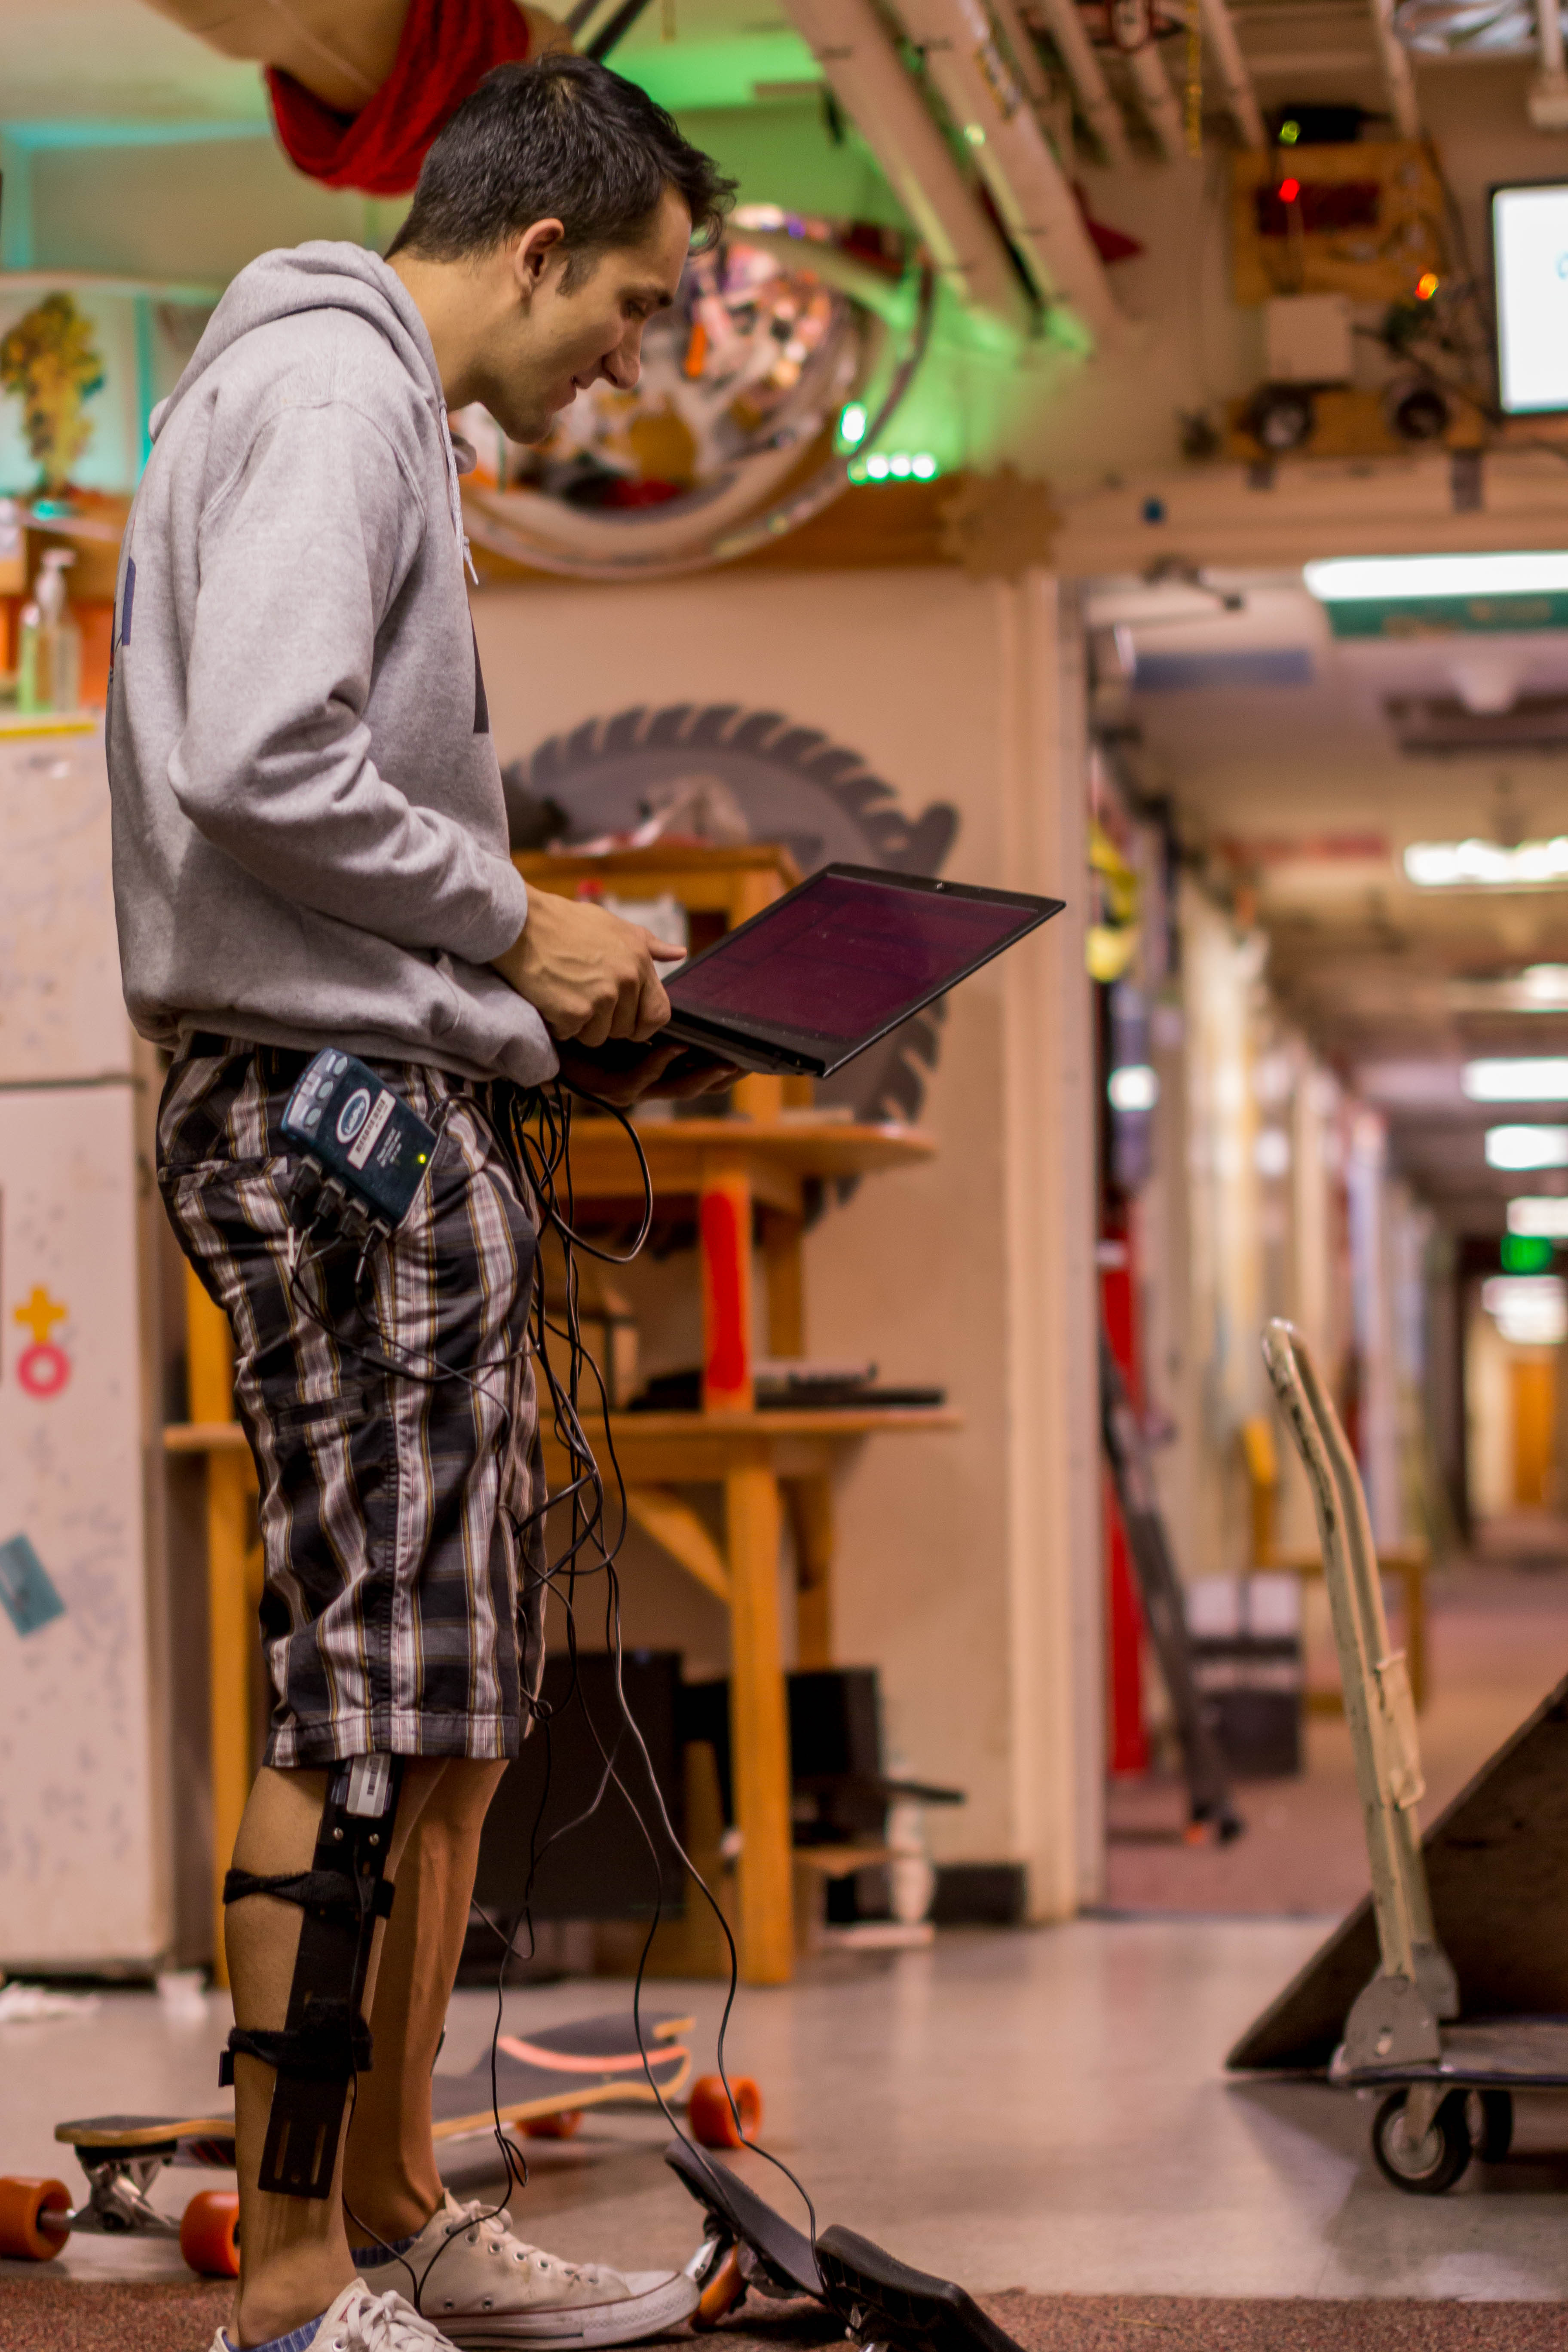
When I said I wanted to be a cyborg when I grew up, this isn’t exactly what I had in mind…
I used far too many sensors for this in hindsight: two three-axis accelerometers, one under each of the front and back panels of the Ripstik; goniometers to measure leg angles, normalized to my default stance angle; and a single axis accelerometer strapped to my chest to pick up overall body acceleration forward.
The Ripstik I used was a Ripstik Air Pro, which is objectively a lot more fun and smooth to ride than the clunky bearing-bar ones. I much prefer the solid injection-molded torsion bar.
I also had all those sensors hooked into a series of LabQuest / Lab Pro / whatever other kind of Vernier sensor-reading hardware needed, hooked into my laptop, while I did speed trials up and down our carpeted hallway at various drive frequencies. I was carrying the laptop the whole time. I only crashed once or twice; nobody was hurt, but the cord to one of the accelerometers did end up getting cut once. Not a huge loss.
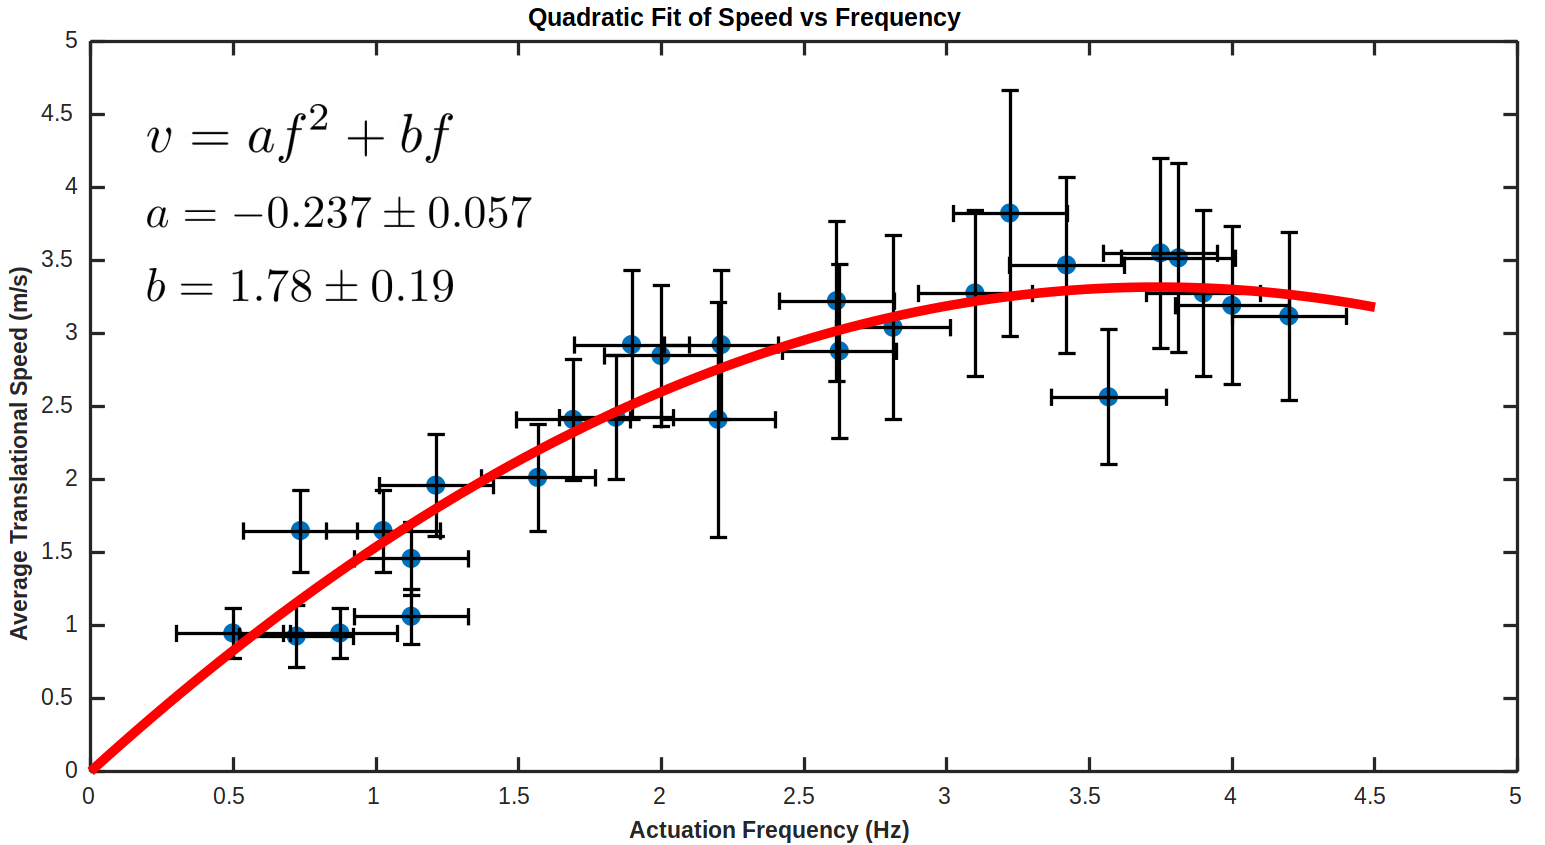
Graphs of data with error bars and curve fit showing maximum velocity and corresponding frequency. 95% confidence intervals given for data points and curve fit parameters.
Anyhow, I did produce some results – I found a vaguely parabolic curve with a local maximum of 3.7 ± 0.2 Hz producing a speed of 3.3 ± 1 m/s. The error bars are reasonably large, but definitely point to a specific region of around 3-4 Hz being the optimal drive region – which is slightly lower than (at least for me) the maximum comfortable drive frequency of 4.2 Hz.
There’s a lot more that went into the project that I won’t elaborate ad nauseum about here – read the final report Here if you’re interested in that!